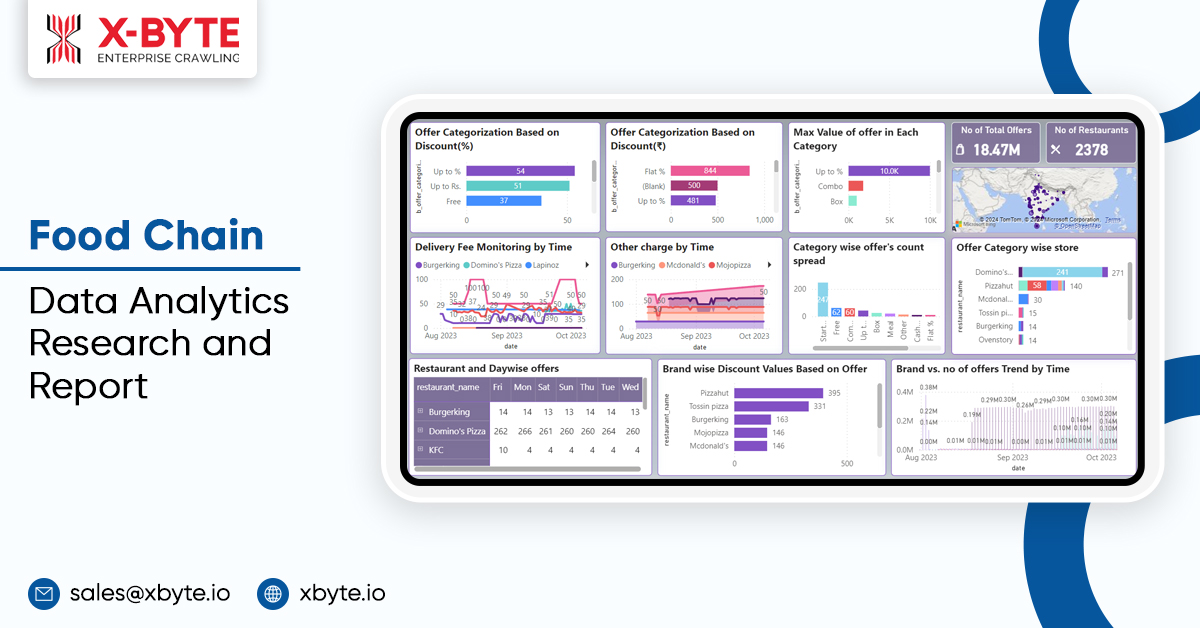
Start Your Food Chain Data ProjectFood Chain Data Analytics – Research and Report
This report presents a comprehensive data analysis of a leading pizza chain, highlighting the insights derived from data analytics and the impact of data-driven decision-making on their operations. The data analytics were conducted to provide a detailed understanding of various aspects, including menu pricing, offer distribution, and overall performance metrics.
Client Requirements
The client required a robust data analytics solution to monitor and optimize various parameters across their restaurant locations. The key requirements include:
- Geo-location-based store availability monitoring
- Menu price monitoring for variants, add-ons, sizes, and categories.
- Store and stock availability monitoring
- Offers and discount monitoring with detailed categorization
- Tracking delivery fees and other charge
- Comprehensive tracking of the number and value of offers, discounts, and price comparisons.
Key Insights of Offers and Menu
The comprehensive analysis of the client’s company provides valuable insights into the competitive landscape and pricing strategies of the various leading Pizza brands. By examining offer categories, delivery charges, starting prices, and regional pricing differences, we can better understand the dynamics and trends influencing consumer choices and brand positioning in the food industry.
- Discount Analysis: Pizza Hut’s “Up To” offers provide 130% more discount amount compared to Domino’s Pizza.
- Delivery Charges: Tossin Pizza’s delivery charges doubled in comparison to Domino’s Pizza around August.
- Price Monitoring: Pizza Hut’s highest “starting price” is 80% higher than that of Domino’s Pizza.
- Offer Value: Domino’s Pizzas’ “Up To” offers are almost times greater than the La Pino’z Pizza in the given dataset.
- Comparative Offers: Domino’s Pizza provides 140% more “Up to” offers than the Oven Story Pizza.
- Average Value Offers: Pizza Hut offers 18 times higher average value offers than Domino’s across various categories.
Insights on Price Trends and Regional
- Price Reduction: While price monitoring, we found that Domino’s Pizza reduced its prices by 9% after August.
- Pizza Pricing: Medium Pizzas at Oven Story cost almost 15% less than those at Domino’s Pizza and Pizza Hut.
- Ingredient-Based Pricing: Domino’s Pizza offers paneer-based pizzas at nearly 50 bucks less than chicken-based pizzas.
- Regional Pricing: Domino’s Pizza in Guwahati is priced almost 10% higher than in Delhi.
- Menu Variety: Domino’s Pizza displayed 12 menu items in September.
- Restaurant Distribution: Most Pizza-serving brand restaurants are in Tier 1 and 2 cities.
Key Performance Indicators for Menu Analysis
- Time-Based Price Trend Analysis: Examining how prices for menu items change over time to identify seasonal or promotional trends.
- Item Size and Corresponding Prices: Analyzing the relationship between the size of menu items and their prices to understand value offerings.
- Top Prices Based on Items: Identify the menu’s highest-priced items to understand premium offerings.
- Prices Comparison Across Variants: Comparing prices of different variants of the same item to highlight pricing strategies.
- Menu Items Across Time: Tracking the introduction and removal of the menu items over time to analyze menu evolution.
- Geographical Spread: Assessing the variation in menu items and prices across different regions to understand regional pricing strategies.
Major Goal of Research and Report
The major goal of this research and report is to provide a comprehensive analysis of discount offers, delivery fees, and pricing strategies among the leading pizza brands. This report aims to identify competitive advantages, consumer preferences, and market positioning by categorizing and monitoring offer values, distribution, and trends. This analysis assists stakeholders in making informed decisions and optimizing their promotional strategies in the competitive food industry.
Benefits of Food Chain Data Analytics
- Enhanced Decision-Making: Provides actionable insights for strategic planning and operational efficiency.
- Competitive Advantage: Identifies market trends and consumer preferences, allowing for better positioning against competitors.
- Improved Customer Experience: Enables personalized marketing and targeted promotions and models for maximum profitability.
- Optimized Pricing Policies: helps in understanding pricing dynamics and optimizing pricing models for maximum profitability.
- Operational Efficiency: Streamlines processes by identifying areas for improvement and implementing data-driven solutions to enhance overall efficiency.
Conclusion
The detailed analysis of pizza market offers, delivery fees, and pricing strategies provides significant insights into the competitive dynamics and consumer preferences. By leveraging data analytics solutions, businesses can make informed decisions, gain a competitive edge, and optimize their marketing and operational strategies. This comprehensive understanding of market trends and brand positioning ultimately enhances customer satisfaction and drives business growth in the highly competitive pizza industry.